Oracle Reports Developer – A Beginner’s Guide
Introduction
This paper discusses the basic techniques that a successful Oracle Reports developer should know. It is intended for the novice user with strong SQL-PL/SQL knowledge who is interested in learning to use Oracle’s Reports Developer.
Reports Developer Basic Tools
To start using Reports Developer, you need the software, a database, and a set of templates. Although Oracle provides a set of templates, they do not provide much functionality. You can download a set of Reports Templates from Dulcian’s website (www.dulcian.com). These exercises use the scott/tiger schema that can be loaded with the Oracle database.
Data sources
It is a good idea to prepare your data even before starting to develop the report. Oracle Reports Developer comes with its own Query Builder that is fairly useful, but the query statement editing box is too small for complex queries and its font is not a fixed size, so that it is not possible to format code using indentation. Large queries are so difficult to read that it is easier to copy the text into an SQL editor, modify it and copy it back. Building the query in an SQL Editor will also allow you to run and optimize it. The report will never run faster than the query it is based on.
As an example, the following query will be used:
SELECT D.DNAME DNAME
, D.LOC DLOC
, E.ENAME ENAME
, E.JOB EJOB
, E.HIREDATE EHIREDATE
, E.SAL ESAL
, E.COMM ECOMM
FROM EMP E
, DEPT D
WHERE E.DEPTNO(+) = D.DEPTNO
Tip: Always alias the columns with the same name by prefixing the alias with a group identifier. If you have a column “Name” in the Emp table, alias it as “EName.” In this way, it will be easier to find in the source names. While this is not necessary for a simple report, it is good practice that will pay off when developing more complex reports with multiple queries.
Report Styles
When you first start Oracle Reports Developer, the Reports Wizard will open automatically. You can also access it by selecting File | New | Report from the menu.
First, you need to select a report style from the following choices:
· Tabular – a simple spreadsheet-like report (see Figure 1)
· Form – displays one form-like record (see Figure 3)
· Group Left – Selected group fields are displayed on the left of the report (see Figure 6)
· Group Above - Selected group fields are displayed on top of the report (see Figure 7)
· Matrix – Special summary report that will calculate values corresponding to a horizontal and a vertical grouping;
· Matrix with Group – A grouping field added to the matrix report
· Mailing Labels
· Form Letter – similar to the Mail Merge capability
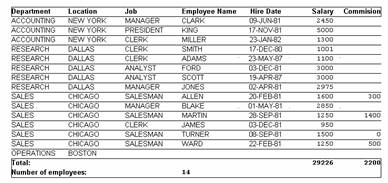
Figure 1 –Tabular Report Example
It is possible that the report you are trying to create is a
combination of the other report types. For example, a Group Above, report with inside
frame as a Group Left, or a form-like on
the inside frame might be needed. In this case, start with the type of report
that best corresponds to the uppermost levels of your desired report. Detail layers
can be added later using the Additional Default Layout. This technique is
described later in this paper.
The Report Wizard
Unless your report is very simple, you should always start writing a report by using the Report Wizard. It is a powerful tool and it can save you a lot of time. Table 1 includes recommendations for each step in the Report Wizard.
|
Report Wizard Step |
Usage and Recommendations |
|
Style |
Select the Report Style as described in the previous paragraph |
|
Query |
Enter the SQL query. The Query Builder is useful for selecting columns and having the joins created automatically. |
|
Groups |
Select the arrows to move the field that you want to group by from the source list on the left to the “Group by” list. If you need multiple levels, collapse the Level 1 tree and the next column will be moved into a Level 2 group |
|
Fields |
After moving the fields in the right box by using the arrows, it is important to arrange them in the order in which you want them displayed. This can be accomplished by a drag and drop action. |
|
Summaries |
Move the fields for which you want summaries from the left area by using the appropriate calculation button (Sum, Average, Count). |
|
Labels |
Modify the labels to show how they should be displayed. It is also extremely useful to modify the field width to the desired size at this point. |
|
Template |
Ask an experienced developer to create a set of good templates for you. These can save you hours in formatting each report. |
Table 1: Report Wizard Steps

Figure 2 – Example of a Form Report with no Wizard Settings
Figure 2 shows a report that was created by using the Report Wizard without any custom settings. This report can be modified to display the report shown in Figure 3 by making the following selections in the Reports Wizard:
· Ordering the columns in the Fields tab
· Modifying the labels and the field widths in the Labels tab (in this case the widths for Department, Location, Job and Employee Name were set to 40 so that the column will appear on a single row)
·
Applying a template
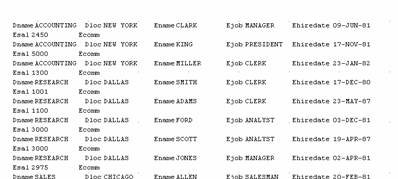
Figure 2 – Example of a modified Form Report
The Report Wizard can be re-entered by simply clicking in a
field, and selecting Report Wizard from the right-click menu. It is more
efficient to re-enter the Wizard multiple times than trying to change the field
sizes and labels individually.
Live Previewer
When the Report Wizard is exited, it displays the report in the Live Previewer. This view is best for the following operations:
· Setting the labels
· Adjusting the fonts
· Adding borders and fill
There are two other ways to display the report: the Data Model and the Layout Model. The buttons to access them are shown in Figure 5.
Data Model
The Data Model contains the logical grouping of data for the report. This is the place where you define the source data, add additional queries, and link them. If you add more queries, it is good practice to rename the groups with short easily identifiable names. It is also advisable to prefix the column aliases with a group identifier. This will come in handy when using the Additional Default Layout to add new frames.
For sorting the report data, you need to use two mechanisms:
1. For sorting the inner frame data, add the sort in the query. For example, if you want to sort employees by name within their group, the following query can be used:
SELECT D.DNAME DNAME
, D.LOC DLOC
, E.ENAME ENAME
, E.JOB EJOB
, E.HIREDATE EHIREDATE
, E.SAL ESAL
, E.COMM ECOMM
FROM EMP E
, DEPT D
WHERE E.DEPTNO(+) = D.DEPTNO
ORDER BY ENAME
2. For sorting the groups, make the column to be sorted by first in the group, and make sure that the Break Order property is set to Ascending or Descending as desired. For example, in Figure 4, the G_Dept group will be sorted by DLOC – location.
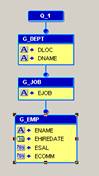
Figure 4 – Ordering the master groups
Layout Model
The Layout Model (shown in Figure 5) displays the physical layout of the data. You can have multiple frames based on the same logical groups as defined in the Data Model.
![]()
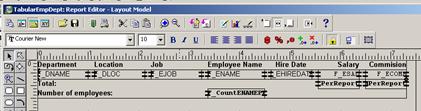
Figure 5 – Layout Model
Fields
The fields are data items that are displayed in the report. For example, the department name is a field.
In the Layout Model, fields are represented as labeled rectangles showing the width and the length of the field. Field sizes can be modified by selecting the field and dragging its handles.
Fields correspond to columns from the Data Model.
Repeating Frames
Repeating frames are used to group a set of fields and repeat this structure for each record.
Figures 6 and 7 show three repeating frames enclosed within each other:
·
The Employee
·
The Job
·
The Department and Location
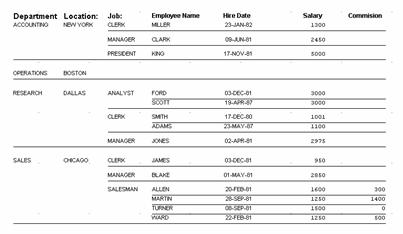
Figure 6 – Example of Group Left Report
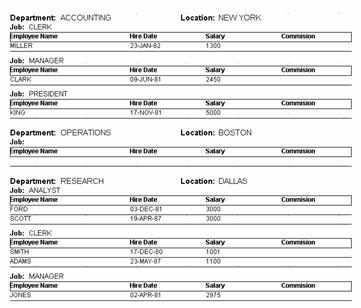
Figure 7 – Example of Group Above Report
The repeating frames correspond to groups in the Data Model. The fields that are included in the repeating frame must be associated with columns in the source group in the Data Model.
The frames are represented by rectangles and their size can be modified by using the handles.
Frames
Frames are used to group a set of fields that do not have any corresponding structure in the Data Model. They are mainly used for anchoring objects.
As described above, the fields in a report may vary in size. Frames are very handy and help save space while providing flexibility in the reports. However, if a field is expanded, the objects that are below it are implicitly anchored to it and will move accordingly. The objects that are not directly below the expanded field will not move and might lose synchronization with elements to which they are related. This might be useful in a situation where fields are grouped in two or more independent columns.
For objects that are related and need to be kept together, frames are a good way of keeping them on the same line and expanding at the same rate. Figures 9 and 10 show how a frame can keep the report organized. In Figure 9, the Domain_CD expanded to two rows and pushed the type field and the name label one row down. The labels and fields for Type and Name are now out of synch.
Adding a variable length frame that includes the Domain label and field and is wider than the objects under it kept the whole line in synch as shown in Figure 10.
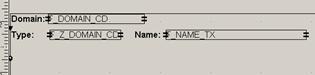
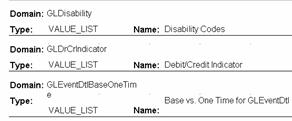
Figure 9 – Variable height field can make the report fields unsynchronized
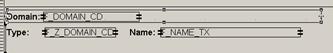
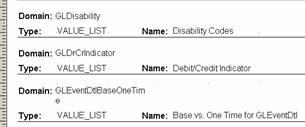
Figure 10 – A simple frame will keep the report organized
The Object Navigator and Property Palette
The Object Navigator presents the objects in a handy hierarchical tree structure. The following operations can be executed in the Object Navigator:
· Modify the system parameters
· Add your own parameters
· Represent the Data Model objects in a hierarchical view
· Represent and select the Layout Model objects in a hierarchical view. This is particularly important because sometimes it is not obvious what the order of the frames is in the Layout Model.
· Display the Property Palette for each object.
Unfortunately, the Object Navigator does not allow dragging and dropping of objects.
The Property Palette had various properties options for each type of object. Table 2 shows a list of the most commonly used properties for fields and frames with suggestions about how to set them:
|
Property |
Usage |
|
|
Field |
Source |
Select a column from the Data Model |
|
Vertical Elasticity |
· If the field content will expand beyond its physical width, the object can be truncated (Fixed), expanded vertically (Expand, Variable). · If the object is smaller than the allocated, its height can be shrunk (Contract, Variable). · In the Layout Model, the vertically expandable fields (and frames) are symbolized with an = sign on the vertical lines. |
|
|
Horizontal Elasticity |
The same as the Vertical Elasticity, but the object will expand horizontally. This property is used less often than the Vertical Elasticity. Italic fonts might be truncated if you use the Variable or Contract setting |
|
|
Conditional Formatting |
· You can format or even hide the field depending upon various conditions · Developer-friendly code writer. |
|
|
Repeating Frame |
Source |
Select a group in the Data Model. |
|
Maximum Records per Page |
Allows you to display a fixed number of records per page, usually “1” for Form-like reports |
|
|
Page Protect |
If set to “Yes,” will not allow the separation of the field contained in the frame, unless the frame extends beyond one page |
|
|
Elasticity, Conditional Formatting |
· Similar to fields · If the fields have variable lengths, it is reasonable to make the frames variable too. |
|
|
Frames |
Page Protect, Elasticity, Conditional Formatting |
Similar to Repeating Frames |
Table 2: Commonly Used Field and Frame Properties
Default Layout
If you need to add a new inner repeating frame with a specific format you can use the Additional Default Layout button. Before you start, the following preparations are useful:
· In the Layout Model, increase the size of all of the frames that will contain your inner frame. Estimate the size of the final frame and allow space for it
· In the Data Model, label all groups with a useful name and alias all columns. You will be asked to select the columns that you want to display in the inner frame from the list of all columns available in the report
· Make sure that the groups containing the columns you want to display are subgroups of the existing parent frames. If not, you can use links.
· Go back to the Layout Model, select the button shown in Figure 11 and draw a rectangle where you want the frame to be displayed. Follow the steps listed in Table 1 for the Report Wizard
![]()
![]()
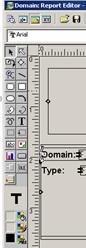
Figure 11 – Additional Default Layout button
·
As with the Reports Wizard, if the frame does
not appear as desired, reapply the Additional Default Layout. However, this is
NOT re-enterable. You need to select the frame and all of its enclosing objects,
(use the Select Frame button shown in Figure11) delete it, and restart the
Additional Default Layout.
Conclusion
In order to be a successful and efficient Oracle Reports developer you need to understand how to use all of the elements shown in Table 3.
|
Oracle Reports
Developer Element |
Points to remember |
|
The Report Wizard |
· Always start with the Wizard. ·
Use and reuse until you are close to what you
need. |
|
The Data Model |
· Build as few queries as possible. · Rename your groups with suggestive short names. · If you have multiple groups, alias the column names by prefixing a group identifier. ·
Reusing groups on various layouts is good and
resource saving (saves your time). |
|
Additional Default Layout |
When you need to change a column size or add/delete a
column, most of the time it is easier to delete the whole frame and recreate
it. |
|
The Layout Model |
Always be aware of and control how your frames and fields
are layered. In order to do this, you can use the Object Navigator, fill
frames, color the frame borders, the Arrange menu, and the Select Parent
Frame button |
|
Repeating Frames |
Properties that you need to know how and when to use:
Source, Maximum Records per Page, Page Protect, Elasticity, Conditional
Formatting |
|
Simple Frames |
Use them for implicit anchoring |
|
Set of Templates |
To save time, get an experienced Reports Developer build one for you and continue to evolve it. |
Table 3: Important Elements in Oracle Reports Developer
The last and best advice is to remember to save your work often.
Additional Documentation
·
Oracle
Developer Advanced Forms and Reports –
·
Oracle Reports Builder documentation on OTN
(http://otn.oracle.com/documentation/reports.html)
·
Other Reporting papers and presentations on
Dulcian’s website
(http://dulcian.com/papers_by_topic.html #Oracle Reports)
·
“Don't Build
200 Reports...Build Just One!” - Ileana Balcu
·
“Reports
Templates: Getting the Most out of Oracle Reports” - Dr. Paul Dorsey
·
“Building a
Flexible Reporting System Template Using Developer/2000” - Joseph P. Strano & Dr.
About the Author