Don’t Build 200 Reports, Build Just One!
Summary
Oracle Reports is a tremendously powerful reporting tool. However, building the reporting portion of a system is usually time consuming and tedious. By carefully designing the database and building a flexible reporting system, a complex set of reporting requirements can be satisfied using a single report. This paper discusses our experiences in building a complex reporting system to support a general ledger system.
Traditional vs. Generic Reporting
A traditional information system may require 100 to 200 reports. Report development is usually not started until the rest of the system is complete, frequently concurrent with the data migration. When the first version of the system is shown to the users, there are usually significant modifications required. This leads to changes in the data model, user interfaces, and of course, to all of the reports. As development progresses, more changes are usually necessary. The same reports must then be modified or rewritten several times. This is one of the reasons why an army of developers may be needed to maintain such a system.
A reporting system can be divided into two parts:
· Functional reports: These include purchase orders, invoices, account statements or various common letters to clients. These reports are run very often and are usually modified less frequently than managerial reports.
·
Managerial
reports: These are the standard summary reports used to support managerial
decision-making. This type of report is frequently subject to change. Users
want to be able to decide what information to include in the report and how
that information
Using generic reporting techniques, the number of managerial reports can be drastically reduced. The functional reports are less likely to be affected, but we have had significant success in building generic letter generators.
In order to reduce the number of reports needed, the data model
must be built to support this philosophy.
Generic data models lend themselves more easily to support generic
reporting techniques. With a traditional data model, you can still use some of
the generic reporting techniques described below, but the success
Flexible Reporting Techniques
The most common techniques for building flexible reports are described in this section.
1. Lexical Parameters
Lexical parameters can replace all parts of the query upon which the report is based
SELECT empno,ename
FROM emp
&p_where
In the example above, the lexical parameter “p_where” can replace the WHERE or ORDER BY clauses or a
combination of them. The lexical parameter can be built either by the
application that calls the report, or by the report itself in a program unit
such as an AFTER-PARAMETER-FORM trigger or a formula column.
2. Temporary Tables
If the various reports you need require processing that cannot be
supported by SQL or PL/SQL functions embedded in SQL, you can use the concept
of Global Temporary Tables. Each session can store its own data in this kind of
table that other sessions/users
The DDL command to create a temporary table is as follows:
CREATE GLOBAL TEMPORARY
TABLE tmp_table (
Column1 VARCHAR2(2000),
Column2 NUMBER(10) ,
…)
ON COMMIT PRESERVE ROWS;
Note that Oracle Forms and Reports always run in different sessions. When you need to use a temporary table for a report, the code to populate the temporary table should be included in the report and not in the calling parameter form.
3. Complex Reporting Front-End
A generic report needs a set of multiple parameters. The Report
Builder has a Parameter Form facility, but it is very basic. You can only use
text items or select an item from a list. No LOV, radio buttons or checkbox
functionality is provided. You cannot have any interactions between parameters.
For example, it is not possible to build a parameter form in Reports where, if
the department is filled in first, only employees from that department
You usually need to build a front-end that
4. Generic Sorts
This is the simplest application of the lexical parameters:
SELECT empno,ename
FROM emp
WHERE deptno=30
ORDER BY &p_sort
The user can choose to order the report alphabetically or by employee number by selecting a value from a list item. You need to remember to set an Initial Value for the p_sort parameter, so that the user won’t get an error if he/she doesn’t select any value.
5. Generic Breaks
If users need to view summaries grouped by various criteria such as summary per department or summary per job type, then you need to create generic breaks as shown here:
SELECT empno
,sal
,&p_break break
FROM emp
WHERE deptno=30
ORDER BY &p_sort
In the Report Wizard you can set the break column in the master
group and use either deptno or job as values for the p_break parameter.
6. Generic Filters
This is another specific application of the lexical parameters. It basically means that you can control the WHERE clause of the query by adding any appropriate filter. The user can then select the column to be filtered, the operation (which can be =, <, LIKE, IN, etc.) and the filtering values.
SELECT empno,ename
FROM emp
WHERE &p_where
In the example above, the initial value of the p_where parameter should be 1=1 for an unfiltered report.
7. Columns to Display
The basic idea for selecting different columns to display is to use aliases for the columns.
SELECT &p_column1 column1,
&p_column2 column2,
&p_column3 column3
FROM emp
…
You need to set the initial value of the p_column parameters to
‘xxxxxxxxxx’.
If you need variable column lengths, then the problem becomes
more complex and you
Note: You can find more detailed descriptions of the lexical parameters, generic sorts, filters, break columns, and columns to display in Oracle Developer: Advanced Forms and Reports (Koletzke & Dorsey, Oracle Press, 2000).
Requirements Analysis
Anyone building a generic reporting system should be familiar with the techniques described above. However, there is no universal method for building a generic reporting system. You need to do a thorough analysis of the reporting requirements even before the data model is frozen. This analysis usually reveals any data model flaws that may make application and reports development much more difficult later in the process.
In general, you should use generic data modeling techniques to support a flexible reporting system. Generic modeling gives rise to models with relatively few tables that easily support flexible reporting. Rather than having lots of small tables with similar structures, with a generic system, a single table that is typed that stores all objects of a similar structure. This enables you to create a single reporting system that can simultaneously support many different types of objects.
Building a General Ledger Reporting System Using Flexible Reporting Techniques
The new reporting system had to include over 200 reports grouped
by department, account, account type, etc. Users needed various comparisons
between periods, departments, budget vs. actual etc. Various levels of detail also had to be supported.
Before starting
development, a more careful analysis of the 200 existing reports was done in an
attempt to categorize them. This analysis led to the conclusion that all of the
reports could be reduced to only 7 types. The final result of only one flexible
report was achieved by using the abstract data model developed for this system.
General Ledger Transaction Data Model
The data model that we used for this system was very abstract. A simplified version of the actual model is shown in Figure 1 to illustrate the principles used.
Figure 1. General Ledger Transaction Data Model
At the root of the model is the idea of a “Book”. In this case, a “Book” consists of a collection of accounts (Book Details) in a hierarchical structure. Different types of books (financial, managerial, etc.) could have different structures.
Each Journal Entry (JE) was attached to a particular Book. Journal entries consist of any number of debits or credits (JE Details). Each JE detail debits or credits a particular book account (Book Detail).
One of the real strengths of the system was allowing JE Details to also be attached to a Department and a Job. This effectively provided hundreds of virtual accounts, and the ability to maintain very complex accounting structures with little maintenance.
The generic reporting system could then report not only for a book but also by department, job, or even the activity of a job within a particular department.
Unfortunately, early attempts to build the system resulted in inadequate performance. Some information needed to be “pre-aggregated” in order to return reports to managers in only a few seconds.
General Ledger Reporting Data Model
To improve performance, a History table (a data repository holding historical summary journal entries) was added to the model. The revised model is shown in Figure 2. Aggregations (done on a monthly basis) could then be performed in a number of different ways:
1. by book detail
2. by book detail and department
3. by book detail and job
4. by book detail and department and job
Figure 2. General Ledger Reporting Data Model
The Parameter Form
The “Control Panel” for the generic report is the Parameter Form shown in Figure 3, which was built using Oracle Form Builder. Its role is to let the user select various report alternatives:
· Style: with or without detail drill down
· Columns: one column, two column comparison with variance, or multiple column comparisons (up to 6)
· Filters: Account, Department, Period, Job
One of the design decisions that proved very useful was to store the report definitions in the database. This allows easy rerunning as well as easier creation of new reports by simply copying a similar old report and modifying one or more parameters.
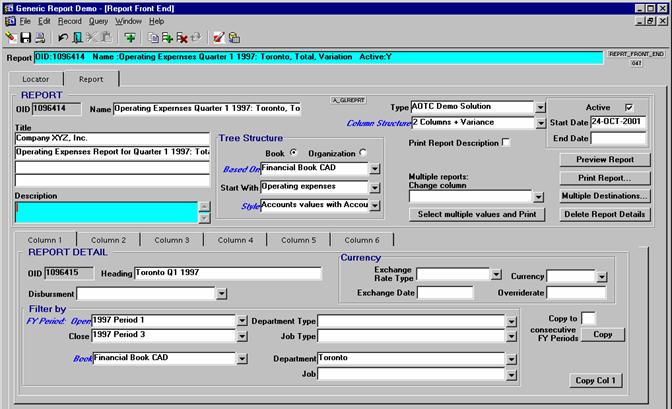
Figure 3. The Parameter Form
The report specifications are stored in two tables containing the
report definition (GL_REPORT) and column specifications (GL_REPORT_DTL).
· GL_REPORT has the following attributes:
|
Column name |
Description |
|
OID |
Primary key identifier |
|
Name, Description |
Descriptive attributes that appear on the front page of each report |
|
Active, Start Date, End Date |
Attributes that allow users to retire reports without deleting them |
|
Title1,2,3,4 |
Users have control over the title rows that they want for each report. |
|
Folder |
Users can easily organize their reports into categories defined and maintained by them. |
|
Column Structure |
One column or two-column comparison with variance |
|
Tree Style |
Show whole tree structure, only leaf values, only summary values, etc. |
|
Tree Structure |
Book structure or organizational structure |
|
Tree Start With |
The starting point for the tree. Null means that the whole tree
|
· GL_REPORT_DTL – holds the columns definitions. Each report can have up to 6 column, defined by the following attributes:
|
Column name |
Description |
|
OID |
Primary key identifier |
|
Column NR |
This allows the user to identify the order of the columns on the report. |
|
Column Heading |
Users have full control of the column headings. |
|
Open FY Period, Close FY Period |
Users can select a fiscal year period or a range of fiscal year periods for a summary report. |
|
[Book] Filter Book Detail |
For organizational structure reports, users need to select the account (book detail) that they want to present. |
|
Filter Org Unit |
Reports such as Balance Sheet can be shown for an Organization Unit, or summarized for the whole company by letting this field have a Null value. |
|
Filter Job |
Reports can be shown for a specific job. |
The user can select an existing report, build a report from scratch, or modify an existing report. When the print button is selected, the report is saved in the database and the form opens the Reports Runtime by sending the report OID.
The Report
Because the user has the flexibility to select titles, column
headings, and report descriptions, it is necessary to prevent showing some
figures with the wrong headings. Therefore, a header page is created that
Having the report definitions in the database made this task easy. This is a simple master-detail report placed in the first section of our report as shown in Figure 4.
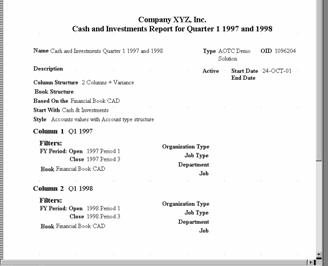
Figure 4. Example of Generic Report Heading
The actual reports are based on a temporary table. A temporary table was used since there were two different tree structures with different parameters to support: organization structure and book structure.
The temporary table has the following attributes:
· Description of the row, which contains spaces to show the tree indentation
· Calculated values for each column defined in the report definition
·
Current row Book Detail OID or Organization Unit
OID that
· Level – used for formatting (such as bolding the first two levels)
· Leaf indicator – used for formatting (to separate the summary values from the source values)
The temporary table is populated from a procedure that is called in the AFTER-PARAMETER-FORM trigger of the report and uses the report definition to calculate values for each row.
Summary reports
The summary reports display the temporary table. Some conditional formatting is used to emphasize some rows such as the calculated rows for the branches of the tree. The titles are displayed in a horizontal repeating frame as shown in Figure 5.
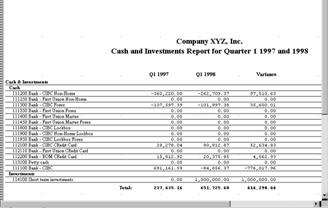
Figure 5. Example of a Summary Report
Detail reports
The detail reports show the source for each figure. A sub frame was used at the row level to show the detail journal entries with the actual figures that make up the summary figures. Lexical parameters filtered the JE records to match the summary record for various report options.
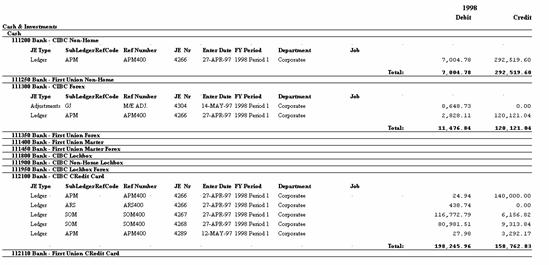
Figure 6. Example of a Detail Report
Conclusions
From our experience in building this system and other reporting systems, the following tips are useful:
· Include a thorough analysis of the reporting system early on the project, before even the data model is finalized. A large number of reports can usually be reduced into a few report types through careful analysis.
· Use abstract data modeling techniques to reduce software development and maintenance time. Even if you have a great deal of experience with such systems, you should call in an outside auditor for your data model. The money for such a task is well spent as opposed to risking project failure because of a flawed data model.
· Keep users in the loop all of the time. Show them your progress and ask for other features that they need during development.
· Consider your users’ computer skills when creating the reporting interface. Many users are accustomed to Microsoft Word or Excel.
· Don’t design the whole reporting system at once. Try building a simple report and then adding more functionality to it.
· First provide users with the functionality that they need for everyday tasks. Develop more complex functionality later as users gain familiarity with the interface.
· Manage user expectations about the project timeframe. Let your managers and users know that they may not be able to see results for several weeks in the beginning.
About the Author