System Tuning Instead of Database Tuning
Michael Rosenblum, Dulcian, Inc
If you ask experts in application development about the best ways to do performance tuning, they will give you a hundred possible answers. If you ask expert DBAs about the same issue, the number of ideas will be in the thousands. From the point of view of the system architect, it seems as though everybody knows perfectly well how to make the part of the system that is their responsibility perform as quickly as possible. However, sooner or later every project hits exactly the same brick wall: the system does not run fast enough. This paper proposes a more structured, big picture “performance grammar” approach that can be helpful in all stages of the project development lifecycle.
Tuning Approaches
Historically, all tuning methodologies could be separated into two main groups:
1. Product-based
a. Native
b. Third-party
2. Function-based.
Native product-based Monitoring Tools
The first group (native) is really a way of utilizing what a specific tool provides. As a result, the whole methodology is based on two dimensions:
· What information about the behavior of the product is available at each point in time;
· How that information can be used to make the system perform better.
The first dimension is the richest if you are looking at the RDBMS or networking. For example, in the Oracle RDBMS, everyone is accustomed to STATSPACK and TKPROF, version 10g introduced a whole new set of automatic monitors – and the number of data sources grows with each release.
But the analysis of information provided by all of these
tools is still an art. There are just too many permutations and nuances even
for “gurus” to understand exactly what is going on. Recommendations often look
like “J. Lewis thinks…” or “The Tom said…”, because it takes too much time to
replicate the whole scenario and thinking patterns. But can the scenario from
the example be applied to your real case?
From the author’s experience, if you use the native product-based approach, little time is spent on real problem-solving. First, you search for a more-or-less similar problem pattern and then you modify your case to look like the closest one. Although this may move the project forward, this does not solve the problem itself. You just avoided it with an often less effective solution that just happened to work.
Table 1 summarizes the pros and cons of using native product-based monitoring tools.
|
Pros |
Cons |
|
1. Monitoring tools are tightly integrated with the kernel which minimizes the impact of monitoring on the main process itself or any other side effects 2. Many tools are used by the manufacturers themselves (such as TKPROF) which makes them highly effective and bug-free 3. If a manufacturer has a number of products, it is easier to have integrated information 4. These tools usually provide a lot of information and focus on low-end data |
1. Nobody can guarantee that in the next version the tool will be still available or have the same features which may lead to migration issues. 2. We have to trust the manufacturer so a third opinion is missing. 3. It is problematic to integrate information from different levels and manufacturers. 4. Huge data volumes make identifying needed information problematic. |
Table 1: Pros and Cons of Product-Based Monitoring Tools
Third-party product-based Monitoring Tools
Third-party tools try to resolve some issues that cannot be
resolved using native tools. Any significant player on the market has (or
thinks they have) a product to make developer’s lives better. Confio Ignite for
Java/Oracle, Quest SQL Tuning, and the
· Versioning of solutions
· Possibility of comparing multiple solutions by a user-defined set of parameters
· Libraries of possible solutions for each class of problem
· Advanced reporting capabilities
To be fair, in Oracle in version 10g aggressively enters this arena by
providing a large number of performance advisors; but we have to be thankful to
other software manufacturers for these changes. Now everybody can recognize
that just having a hundreds of init.ora-parameters is not enough to tune the
system. You need both a
· Input matrix (Methods/Parameters/Results) – specifies the decisions that could be made to resolve a specified problem. There are different ways of describing the set of possible solutions, but the idea still is the same. You detect all valid algorithms and for each algorithm describe all input data (variables/conventions/definitions). For each combination of input parameters, you provide either the expected or testing result (whenever possible).
· Analytical matrix (Precision/Effectiveness/Cost) – resolves each valid option to a level where more quantitative priorities could be set. First, you need to define the solution boundaries (for example, some memory tuning techniques are applicable in one operating system and not in another). Next, you need to make an expert judgment about how good the solution is based purely on its effectiveness (complete/mostly complete/partial etc). The last task is to estimate all costs associated with both the development and implementation of the solution.
With the current level of
complexity of database-related projects, there are very few problems that have
one and only one correct solution. Even if that solution exists, the time allocated
to spend on the problem is usually less than the time required to find the optimal
solution. As a result, in the near future, integration of
|
Pros |
Cons |
|
1. Pre-processing of raw data makes the process of performance analysis simpler. 2. 3. These tools provide better integration with non-Oracle software |
1. We have to trust the software manufacturer, because the technique of pre-processing is hidden. 2. Nobody yet knows where to draw the line between automatic and manual processes. 3. The additional cost of third-party tools must be added to the cost of Oracle licenses. |
Table 2: Pros and Cons of Third Party Monitoring Tools
There is one major problem with any product-based performance tuning concept. It is barely a “methodology,” because usually it is nothing more than a set of tools and best practices about how to use these tools. There could be a number of reasons but the major one is very simple: there is no single product which can be used to build the whole system. Each tool may be perfect for its intended purpose, but there are currently no third-party tools that provide true end-to-end solutions.
Function-based Tuning
Function-based tuning concepts have naturally evolved from the problems that developers encountered with product-based solutions. It has been the author’s experience that, sooner or later, most developers decide to build some kind of a structure to capture performance information only about the module that they are working on. When writing a module, you always know its major functional parameters. As a result, you have a significantly better chance of setting the correct tuning priorities (for example, who cares if an overnight batch process takes 80% of the CPU as long as it can load all of the data before people come to the office). You also know what additional information could be crucial for tuning and debugging. Therefore you can create your own tuning methodology by defining:
· A set of “things” to be monitored – explicitly in the code
· A set of additional data to be logged – explicitly in the code
· A set of measured quantities that define the appropriate and inappropriate behavior of the module – in specifications
· Best practices of interpreting the collected data – usually in your head.
Some development teams are starting to standardize these “home-grown” monitoring tools and reuse them across projects. But since these tools were built to answer very precise questions, they include the original concepts of the first module for which they were designed. Thus the “global” tuning methodology of the project is nothing more than an extension and summary of the methods of each functional module. Table 3 summarizes the pros and cons of function-based tuning.
|
Pros |
Cons |
|
1. A function-based approach is usually implemented in the most critical system areas. By looking at what areas have been monitored more actively than others, the tuning efforts can be better focused throughout the development and implementation processes. 2. Function-based technologies are built by developers for developers so there is no need for extra “translation.” 3. Since the team who built the monitoring tool is usually the same one using the information it provides, this information is clearly communicated and properly used. |
1. This type of tuning is very limited by design and often difficult to extend or alter. 2. When modifications are needed, the tuning concepts are not always used in the way in which they were originally intended. It can lead to unexpected results and unwanted side effects. 3. “Bottom-up” development often misses system-wide effects (integration of functions is the most complicated part ). 4. Tuning aspects of different modules may not be compatible. |
Table 3: Pros and Cons of Function-Based Tuning
In general, the function-based approach works the best as long as the project is not very large or the number of developers is limited. There may be too many ideas hidden inside of the code where you may be blinded by nice data monitoring and miss the real problem. Alternatively, you can go crazy by looking for a problem that is really a side effect of incompatible tuning methods. Neither situation is desirable.
System Tuning Methods
From the point of view of a rank-and-file developer, the current state of system tuning may be acceptable. There are new tools with new features, etc. However, from the broader view of system architect, the situation is far from reasonable. The number of failed projects due to unacceptable performance discovered in the later stages of the project is enormous. There are a number of reasons for these failures:
1. Communication gap between different teams involved in the same project
· Having the option of using so many different tools and selecting the right one often becomes problematic. Architectural decisions become more complex because, in some cases, the decision is forced not by the current information, but by market expectations. This is especially true with user interfaces (JSP, JSP/Struts, JSF....)
· There are too many details in each tool. Because of the increased complexity of the development environment and significantly narrow specialization of different teams, the whole process of explaining why one solution is valid for the whole project and one is not can be problematic.
2. "Wars” between different teams working on large projects
· The problem of placing business logic in different places can become a political rather than a functional decision Without an influential architect at the top, the whole process can become an issue of who can first declare ownership of the problem.
3. “Managerial” decisions instead of architectural ones
· Because of the high project failure rate, system architects often have less decision making power in a project than managers. This may decrease the initial cost of the system (so everything looks good on the paper for top management) , but can cause major problems down the road during the development and implementation processes when cut corners produce disastrous results.
4. Original goals were unreachable from the very beginning
· There is no trusted way of predicting performance in the early stages of a project. It is still an architect’s vision that drives the original specifications. In large projects, it is impossible to predict how the whole system will “mutate” between the original specifications and the final implementation.
Many of these reasons for project failures can be avoided by asking two questions:
1. How can you get different teams to speak the same language?
2. How can you create a generic performance measuring mechanism?
Having a system tuning methodology is a reasonable way to answer both of there questions. The proposed tuning language consists of the following elements:
·
Command is an atomic part of the process (any
command on any tier)
·
Step
is single logically complete operation, which consists of a number of commands
· Request is an action consisting of a number of steps. A request is passed between different processing tiers.
·
Arc is a complete processing cycle in one
direction (always one-way) that could be either a communication step between
one tier and another, or a set of steps on the same tier.
·
Token transfer is a point of the
algorithm where the current activity is transferred from one level to another.
· Round-trip is a complete cycle from the moment the request leaves the tier to the point when it comes back with some response information.
Using this terminology, a generic 3-tier application could always be described as either a 9-arc or a 5-round-trip structure as shown in Figure 1.
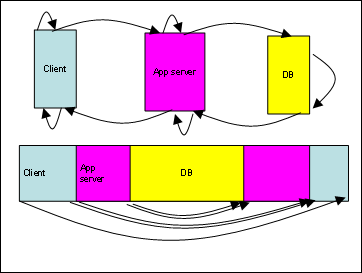
Figure 1: Diagram of Generic 3-Tier Application
Using the example of a 3 tier-system (JClient/Oracle IAS 10g/Oracle DB 10g) where a client application needs to move a customer from state A (newly received data) to state B (potential interest), the following steps would apply:
The 9-arc structure represents the whole set of actions in the following way:
1. Pre-process of the request on the client
· Collect information about currently connected user and other global parameters
2. Send the request to the application server
· Call a servlet with appropriate parameters
3. Process the request on the application server
· Take passed parameters and prepare required PL/SQL calls (set bind variables)
4. Send the request to the database
· Fire database call via JDBC
5. Process the request in the database
· Execute requested procedures and set appropriate output bind variables
6. Send the request back to the application server
· Pass output variables back to the servlet
7. Interpret the processed request on the application server
· Analyze received data and prepare response that could be understood by the client app
8. Send the request back to the client
· Return response to the client
9. Interpret the processed request on the client
· Interpret response and execute corresponding UI-activities
The 5-round-trip structure is significantly simpler and could be used when detecting a single-directional arc is problematic (usually, it happens with steps #2,4,6,8 – networking activity is always a bit tricky):
At the client level:
1. From the moment request was initiated to the end of processing
· User clicked the button/response is displayed
2. From the moment request was sent to the application server to the moment response was received Start of servlet call end of servlet call
At the application server level
1. From the moment request was accepted to the moment response was sent back
· Start of processing in the servlet/end of processing in the servlet
2. From the moment request was sent to the database
· start of JDBC call / end of JDBC call
At the database level
1. From the moment request was accepted to the moment response was sent back
· start of the block/end of the block
The described process with corresponding analytical models allows both developers and architects to communicate more precisely and articulate problems in a way that is understandable to all. Another advantage is that there is a common measuring point. Since all actions within the scope of the same request, it is possible to make comparisons. Switching from code-driven tuning (initiated by some programming event) to user-driven tuning (initiated by a user request), provides a significantly better understanding of end-user needs. Since IT systems are built to make the life of end users better users’ feelings about the system can make or break a project.
The next section describes a number of real cases where the system tuning process described here was used.
Case studies
The system tuning methodology described above is already working in a number of projects at Dulcian, Inc. Two examples represent both classical client-server and more contemporary 3-tier architectures will be described.
Multi-
For this project, the “famous” problem of inheriting a project from another team was encountered. As always , the architecture had already been defined, and there was a huge amount of existing code that was “supposed to work”. As the project got closer to completion the following issues arose:
· Parts of the code were written by different teams.
· There were three different communication channels plus a number of internal pseudo-languages being used.
· There were no defined end-user goals.
· There were no defined performance measurements.
Because of time pressure, our team decided to tackle one problem at a time. But very soon we were losing complete control on the system. At that point, the system tuning approach was implemented, which ended up saving both time and the system itself.
As a starting point, we needed to identify the most critical end user requests. It is very important for development teams to understand the prioritization of system modules and performance boundaries. Otherwise it is impossible to say what is adequate and what is not. In this case, we had a set of tasks performed by a single operator a few times each week (OrgTree maintenance). Originally, this appeared to be low priority issue, but later we figured out that a set of changes could be quite extensive and could have some side effects on the running system. Finally, we had to not only modify the architecture, but spend a significant amount of time on tuning.
The next logical step was to identify the full path from initialization to completion (start/end points of each arc and points of “token transfer”) for each request, including all required resources for each arc/roundtrip. The process of laying out the path in and of itself can be helpful in identifying problems. When we described the whole process of creation of a new customer from top to bottom, we found that the last step (on the database) required too many exclusive row locks in the generic table where the length of a single row was less than one block. But since Oracle locks are implemented by blocks, we were locking more than was needed. That discovery led us to completely rethinking the database locking points in the system.
Once all of the request paths have been identified, you can start defining standardized practices, since you have enough information to combine requests by common properties. This step ensures that you don’t have multiple implementations of the same task. In our project, a whole set of problems was caused by the fact that Java programmers do not know SQL and don’t use bind variables. As a result, there were a number of very similar SELECT-statements with hard-coded parameters. Replacing these queries with a more generic mechanism decreased wait-times on initial loads from 25 seconds to 7. After some fine tuning, that number was reduced to 3 seconds.
The last part of the process is to validate the
scalability of the system. For each request type, we defined an average and
maximum number of requests per period of time and re-evaluated the required
resource consumption of each step in the path. A problem area was detected because
of the nature of Dulcian’s State-Transition Engine (
The system is now fully operational worldwide, new modules are released regularly, and the whole development cycle is supported by the team about one-third the size of the initial one (which was inherited from the client side of the project).
Client-server OLTP system with a small number of users but highly
complex code
Another system currently in production started as a pilot project in Oracle Forms 9i to test the application repository before moving the whole solution to a JavaServer Page-based system. From the very beginning, nobody cared about real production usage, scalability, or extensions. At some point the client started to wonder it was necessary to migrate to JSPs if the testing application runs well enough. Now the problem of production evaluation became the most critical success factor.
Life became even more complicated because, although physically the project was a client-server application, internally it could be described in terms of 3-tier logic: client application/application repository/production data. Since the system end users would actually only interact with a small number of modules using a very limited set of commands, the process of identifying requests, arcs and standard practices appeared simple. However, the whole application repository was a big black box. There were just too many requests and too complicated a structure. As a result of system tuning analysis, we proved that validating the existing repository against the required workload would result in a successful production system without the rewrite.
From the same results identified all of the required resources and possible bottlenecks. This left the question of scalability. We were able to start extending the system on all possible dimensions with no problems. But when the amount of repository rules reached a high level, we started to see significant degradation. Since were still in testing mode and we were able to identify the large number of rules as a possible danger. However, a significant amount of work was required to make the rules reusable.
In this case, even though system tuning methodology did not
help with the original development cycle, it provided a valuable resource for decision making in later
project stages, because we had an articulated a way of describing problems and
identifying of suspicious areas.
Summary
System tuning is a product-independent methodology applicable to mostly any project. Its top-to-bottom approach increases the chances of making correct system-wide architectural decisions. The unified vocabulary makes the discussion of these decisions between the different teams involved in a project significantly easier. In addition, a system tuning mechanism makes it easier to detect possible dangers in the early stages of the project.
This system tuning methodology is not a “silver bullet,” but the difference between no methodology at all and something complete enough to provide meaningful results is significant and leads to successful, working systems.
About the Author
Michael Rosenblum is a development DBA at Dulcian, Inc. He is
responsible for system tuning and application architecture. He supports Dulcian
developers by writing complex PL/SQL routines and researching new features. Mr.
Rosenblum is the co-author of PL/SQL for
Dummies (Wiley Press, 2006). Michael is a frequent presenter at various
regional and national Oracle user group conferences. In his native