Oracle Reports is a very powerful tool that is perhaps the most productive report writer on the market. This paper lists several tricks that are our favorites. We also briefly mention some of the new features in Reports 3.0.
1) Managing Reports with Forms
Very large reports have problems. A large report is one that may consist of multiple reports, with multiple queries on one physical layout. The best and most efficient way to handle these very large reports is to break them into separate reports and use a form to manage the running and printing of them.
You can use the form to run the various parts of the report in order, if need be, or to only run one section of the report. This task is quite simple using the Run Product function and all of its various settings. You can do many things this way such as:
· Skipping the preview of the report
· Setting the form to run continuously through all parts of the report
· Passing continuous page numbers from report to report (This is discussed further in the next section.)
It can be very efficient, fast and simple to use a form to manage a large report since large reports tend to have many unpredictable problems.
2) Passing Page Numbers to a Report
As mentioned above, you can pass page numbers to a report from a form. This makes using a form to manage reports even more efficient and attractive because it gives you a lot of flexibility.
To pass page numbers to the report, you need to set a user parameter in the report and a variable in the form that either the user sets at each run time or which has an initial value. In the report, place a field on the layout where the page number will display and give it a source of place holder formula column. Then write a format trigger for the field. The format trigger will override the original field source unless the trigger is false. The format trigger should look like the code below:
tempnum number;
Begin
srw.get_page_num(tempnum);
srw.set_field_num(0,tempnum+(To_Number(:Start_Page)-1));
globals.page_numbers := TempNum+To_Number(:Start_Page)-1;
return (TRUE);
end;
The code uses the SRW.GET_PAGE_NUM function to get the true page number. Then it uses the SRW.SET_FIELD_NUM function to set the page number. The function is initialized to zero and then the value is calculated. The parameter START_PAGE is the number supplied by the form. The global is used to pass the number back to the form. This is discussed in the next section.
3) Passing Page Numbers Back
to a Form
You can also pass the number of the last page of the
report back to the form, for continuous pages in
different physical reports.
Use a global variable that is stored on the database
that can be picked up from the form. You can see
an example of this in the code in the section above.
The global variable GLOBALS.PAGE_NUM is a variable
defined in a package in the database called globals.
This number is calculated the same way as the value
used in the report.
4) Starting a Report on a
Page
Other Than 1
You can use the method mentioned in Section 2 if you have a number of reports and want to use a form to manage them. But if you have only one report that needs to start on a page number other than 1, you have two choices:
1. Create a user parameter and set the initial value to the correct page number. Then use the SRW.SET_FIELD_NUM function to set the page number.
2. Create a user parameter, put the parameter on the Parameter Form and set it at run time each time the report is run. Here again, you’ll need to use the steps in the second part of Section 2 to complete the task.
Either of these options can be used to change the starting page number of a report.
5) Alternating Page Headings
In reports, you have the ability to alternate page headings by reading the page number. This can be very useful when writing reports that are published, such as a book.
Create the fields and frames on the layout where they should appear. On the frame, write a format trigger that uses the SRW.GET_PAGE_NUM function to get the page number. If it is odd or even, depending on which header you are on, return “True.” Do the opposite on the opposite side. An example follows:
Page_num Number;
Begin
SRW.Get_Page_Num(Page_Num);
If MOD((Page_Num+(To_Number(:Start_Page)-1)),2)
!= 0 Then
Return(FALSE);
Else
Return(TRUE);
End If;
end;
This code declares a variable Page_num to place
the page number returned by the SRW command
Get_Page_Num. Then it uses the MOD function
to determine if the page that the report is on is odd
or even by reading the current page plus the starting
page. Since this report may not
start on page one, it subtracts one because this report had a page added in the
beginning that contains a map. It then divides by two. So if all that doesn’t
equal 0, then the page is odd and should be printed. For even pages, the MOD
should equal 0.
6) When to Use Anchors
An anchor is an object that implicitly or explicitly defines an object’s X and Y coordinates. Reports implicitly defines anchors for all objects when you use the default layout capability. However, Reports also includes the capability to explicitly define an anchor that overrides the implicit anchor defined by Reports, by using the anchoring tool on the tool palette.
The most common use of anchors is when you want to keep two horizontal fields together. The fields can be in the same repeating frame or they can be in different repeating frames.
Anchors can also be used when you have a field that expands or contracts with the size of the data and you want the field either to the right or left of it (depending upon the alignment) to slide with it as it shrinks and grows.
Anchors can also be useful when you have a field moving around the layout that you want to stay in one place. This can happen when the implicit anchor is deleted from an object or on objects that you manually create on the layout.
If you are creating reports to run on a character-based machine, you can use the Snap to Grid feature instead of anchoring because of the fixed fonts.
7) How to Prevent Orphaning
a Master at the Bottom of the Page
When you use the master-detail report layout, you may run into the problem of different sized detail blocks that cause masters to get separated at the bottom of pages. To prevent this from happening, delete the MGRPF frame that surrounds all Reports-generated repeating frames. Go to the property sheet of the repeating frame. On the General Layout tab, check on the “Keep with Anchoring Object” choice. This prevents a master that is too long for the current page from separating onto another page. It will move the whole master/detail to the next blank page.
If you have a master, master/detail report, you will have to perform this operation on each repeating frame.
8) Various Strategies for
Using Dots in Reports
By dots, we mean periods that connect two fields of information such a name and phone number that display with dots or periods leading from one field to the next. An example would be a phone book. Dots make matching two pieces of information across a page much easier.
There are two ways in which you can achieve the displaying of dots. The first and most accurate, but quite involved method, is to create a table that stores the exact pixel size of every letter with the font you are using. You then read each record as it is returned and select all of the letter sizes from the table summed. You now have the length of each field and can display the exact number of dots between the fields.
You can see how this method can take some time and effort. There is however another way to display the dots. You create the layout with all the fields as they should be. Then you create a text field the length of the left most and right most fields that you want to have dots display. Fill the text field with periods. Select each of the fields individually. This may be tricky because of the text object being on top but you can move it around and shrink it a little if you need to get to the fields underneath. On each of the fields, put a fill color of white and under the Arrange menu choice, bring the field to the front. It is very important to also go to the fields property sheets and, on the General Layout tab, set the sizing to Horizontal Variable. The dots will now display between the fields.
Make sure that the dot text field is long enough on the ends so that if the field is short, there will be enough dots. You may also want to place a blank text field, with a white fill color, to the left of any of the fields that have the dots leading up to them. This will ensure that a set amount of space displays before the field, thus creating consistent spacing.
This way is much easier and
faster; however, it isn’t quite as accurate. Accuracy in this case refers to
the number of dots between the fields. In this second method, you can get half
dots or an uneven amount of space between the last dot and the beginning of the
field text.
9) Centering A
Matrix/Crosstab Report
Here is a little trick to centering a matrix or crosstab report. In this example, the columns of the report are actually rows of data in the database, not columns. This tip can also be used for a matrix report where the user selects columns. The report is being run dynamically from a Forms front-end. One of the parameters being passed to the report is the row that the columns of the matrix are based on, p_fund, which is a code value.
They way you center the report is to create a user parameter that is character with a fairly large width, depending on your font and where you want the report to display. In the AfterPparamterForm trigger, use the instr function and search for a comma. Write an “if” statement for however many commas you want to be the deciding factor on whether to center the report, for example, two or three selections. Then, if the condition is true, fill the parameter with spaces. You will have to test the length of the spaces to get the report where you want it to display. If the condition isn’t true, then return no space or ‘’ to the parameter.
In the layout move the report layout over to approximately where you think it should be. Place a frame to the left of the report that fills the space. Make sure the frame has a sizing property of “ horizontal variable” and a print condition of “all.” Put a display field in the frame and select as its source the parameter that you created and used in the trigger. The field should also have a sizing of “horizontal variable” and a print condition of all.
Figure 1 shows how the report layout should look:
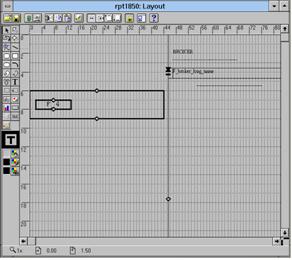
Figure 1: Matrix Crosstab Report Layout
You can see the frame and the field F_4 in the field that has the source Dummy, the user parameter designed to hold the spaces to center the matrix.
To test where the report will display, pass different selections to the report. If you aren’t running the report from a form, create a field on the parameter form that has a source of the parameter that you created, then enter different selections and run the report.
The following is an example of the code in the AfterParamterForm trigger:
outchar := :p_fund;
commaloc := instr(outchar,',',1,2);
if commaloc < 7 then
:dummy := ' ';
elsif commaloc > 7 then
:dummy := ' ';
end if;
The variable outchar is assigned
the value of the parameter that is being passed to the report from a form and
checked for commas. The variable commaloc is assigned the instr function that searches for the commas. In this case, it is
looking for two commas, or three values. The “if” statement is written so that
if the value of commaloc is less than seven, then the space is returned to the
dummy parameter. If the parameter that is displayed in the layout is large and if it is less than seven, there
is no space returned.
10) Using Product Order in Matrix/Crosstab
reports
Product order is located on the General tab of a Summary Column. This function appears grayed out when doing summary columns anywhere else besides in the matrix/crosstab group of the query. The Product Order function allows you to set which of the groups, or, in which order the groups inside the matrix/crosstab group the summary function should be performed.
In Figure 2 below you can see the choices for Product Order. In this case, the groups inside the matrix/crosstab are G_fund and G_broker, so the choices are either of these groups or both of these groups.
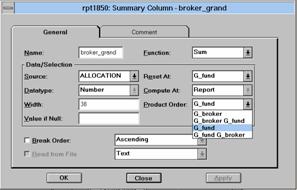
Figure 2: Product Order in Matrix/Crosstab Report
In this case, the correct choices are either G_fund or G_fund G_broker. The reason is that the Product Order must correspond to the Reset At group. Therefore, there is also a Reset At group for G_broker. If this was the case, the other Product Order choices would be your best selections.
You will get an error if the Reset At group and the Product Order groups do not correspond; so be careful when doing summaries at the matrix group level. You can see the amount of flexibility this gives you with the report. You can get the summary at only one level of the matrix or at both levels in the order you choose. Because of the numerous frames with a matrix report, this setting can be imperative to your reports summary needs. In this case, I needed the summary at the uppermost level of the report - the fund level.
11) Counts of Record Subsets
Counts of record subsets refers to a report that categorizes information,counts the number of records returned for each category and displays the count instead of the data itself. You can also use this method to return sums of amounts for a category.
In the detail group of the report, you create formula columns that are numbers. The formula is an “If” statement for each category. If the conditions are met, then you return a one; if they are not, you return a zero. Then, in the master group of the report, you create summary columns. Define the columns as a sum and the source as the formula columns from the detail group. This gives you the count of the number of records returned that fit into each category.
An example of the code follows:
begin
if :occ_code = '0110' then
return 1;
else
return 0;
end if;
end;
The condition in this code is easy, whether the occ_code equals 0110. There is also a summary column that sums all the records that returned as a one form this code and displays the sum.
12)
Performance Optimization
There are number of things that you can do to better optimize the performance of reports. A few of them are listed below.
A) Move all functions with cursors to the database and embed them into the query. This makes large cursors much, much faster.
B) You should never need to build summary or aggregate tables form a report. Only under extraordinary circumstances, when it is the last choice should you build them. The cause dramatic differences in the speed of the report when the tables are large.
C) Avoid multiple queries in a report. In the Data Model, it is very easy to link multiple queries together. However, linking multiple queries together effectively creates correlated subqueries. For every record fetched from the master query, a separate instantiation of the detail query is created. Usually, performance can be increased by reducing the number of queries, ideally, to one. Of course, it is not always possible to do this. However, when looking at the data model, it is important to recognize that all that is trying to be accomplished is to create the information in your report. As long as the same information is getting into the same groups, the queries can be crafted in such a way as to optimize performance.
D) Perform standard PL/SQL and SQL tuning as you would anywhere else. This is just as important in a report as it is anywhere. Careful tuning can dramatically change the performance of a report. An example of things to be careful of is having SYSDATE in a loop. Assign SYSDATE to a parameter and use it from there in any loop. This way there is only one hit to the database instead of one every time the loop runs.
What’s New in
Reports 3.0?
There are some nice new features in Reports 3.0 designed to make development easier and more efficient.
1. There is SQL 2.0 support. A list of values can be pulled into a local table and used in post query look-ups.
2. One very helpful tip is to create a template to support GUI standards. Reports 2.5 didn’t support templates. Version 3.0 does. It is very efficient and can make a huge difference in the turnaround time for your reports.
3. There are new Wizards in Reports 3.0 that make report creation much nicer and faster.
4. There is now a Live Previewer for the reports. This means that you can change layout features right in the previewer and see the change instantly instead of having to go back and forth and keep running the report.
5. There are also real Property Sheets as in Forms. This allows for multiple object selection and all of the features that the Oracle Forms product contains.
6. There is a new Reports Server that can greatly improve runtime throughput.
7. Reports can now be delivered for the Web.
Conclusion
In this paper, we have presented a few tips that you will hopefully find useful. If you have any questions or comments or if you have any tips of your own, e-mail the authors at:
pdorsey.dulcian@worldnet.att.net or
bsherer@worldnet.att.net